library(tidyverse)
library(ggpubr)
library(ggstatsplot)
library(ggExtra)24 散点图
grouped_ggscatterstats(
  data = mtcars,
  grouping.var = vs,
  x = mpg,
  y = disp,
  type = "non-parametric",        # 使用Pearson相关系数
  marginal = TRUE,            # 显示边缘分布
  digits = 1,
  bf.message=FALSE,
  xsidehistogram.args = list(fill = "#009E73",color='black',linewidth=.5),
  ysidehistogram.args = list(fill = "#D55E00",color='black')
) & theme(ggside.panel.scale = .3)
Registered S3 method overwritten by 'ggside':
method from
+.gg ggplot2`stat_xsidebin()` using `bins = 30`. Pick better value `binwidth`.
`stat_ysidebin()` using `bins = 30`. Pick better value `binwidth`.
`stat_xsidebin()` using `bins = 30`. Pick better value `binwidth`.
`stat_ysidebin()` using `bins = 30`. Pick better value `binwidth`.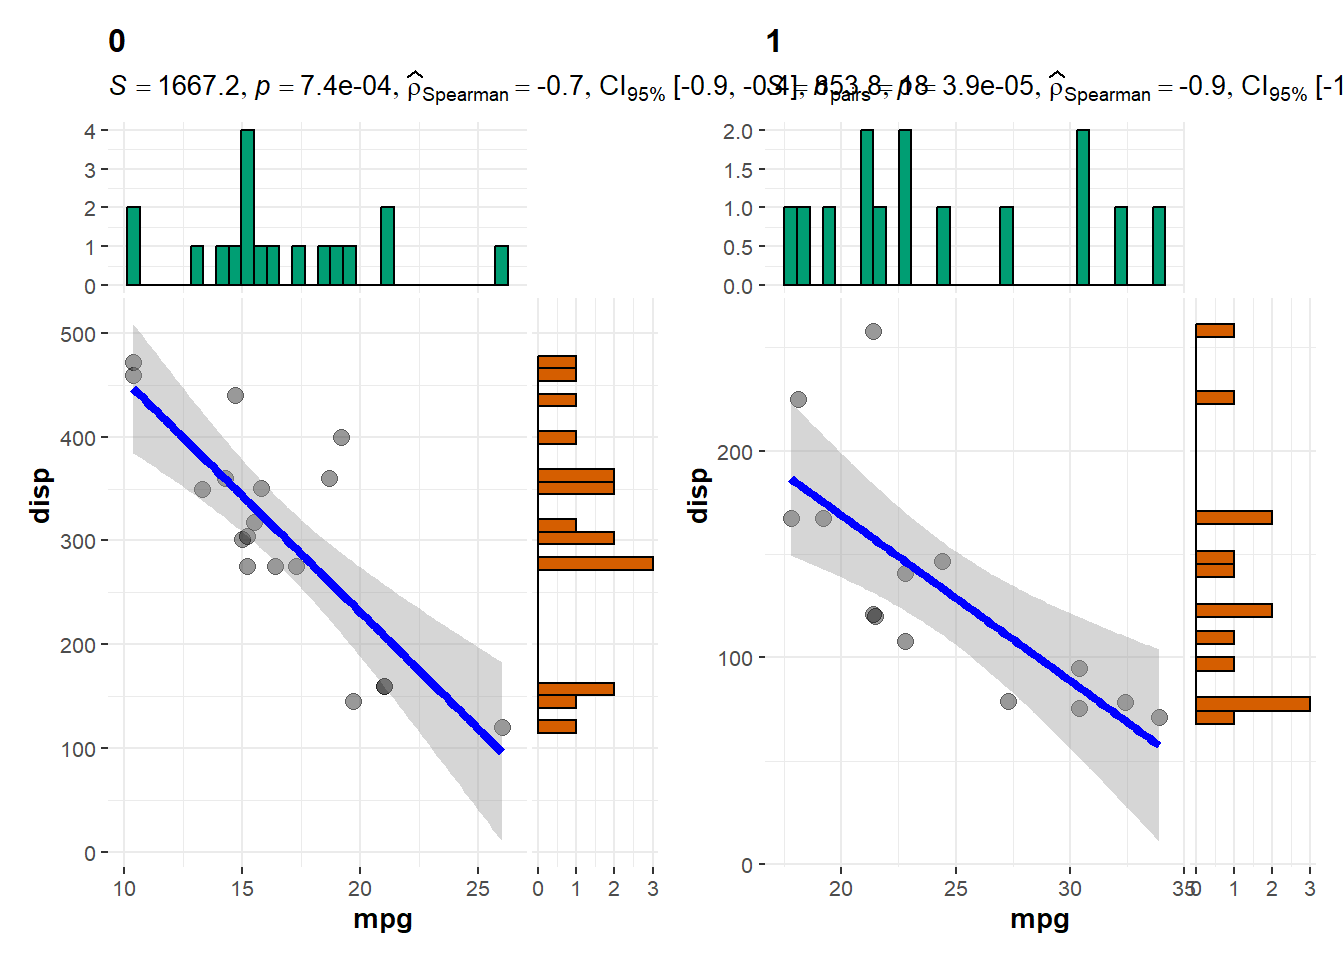
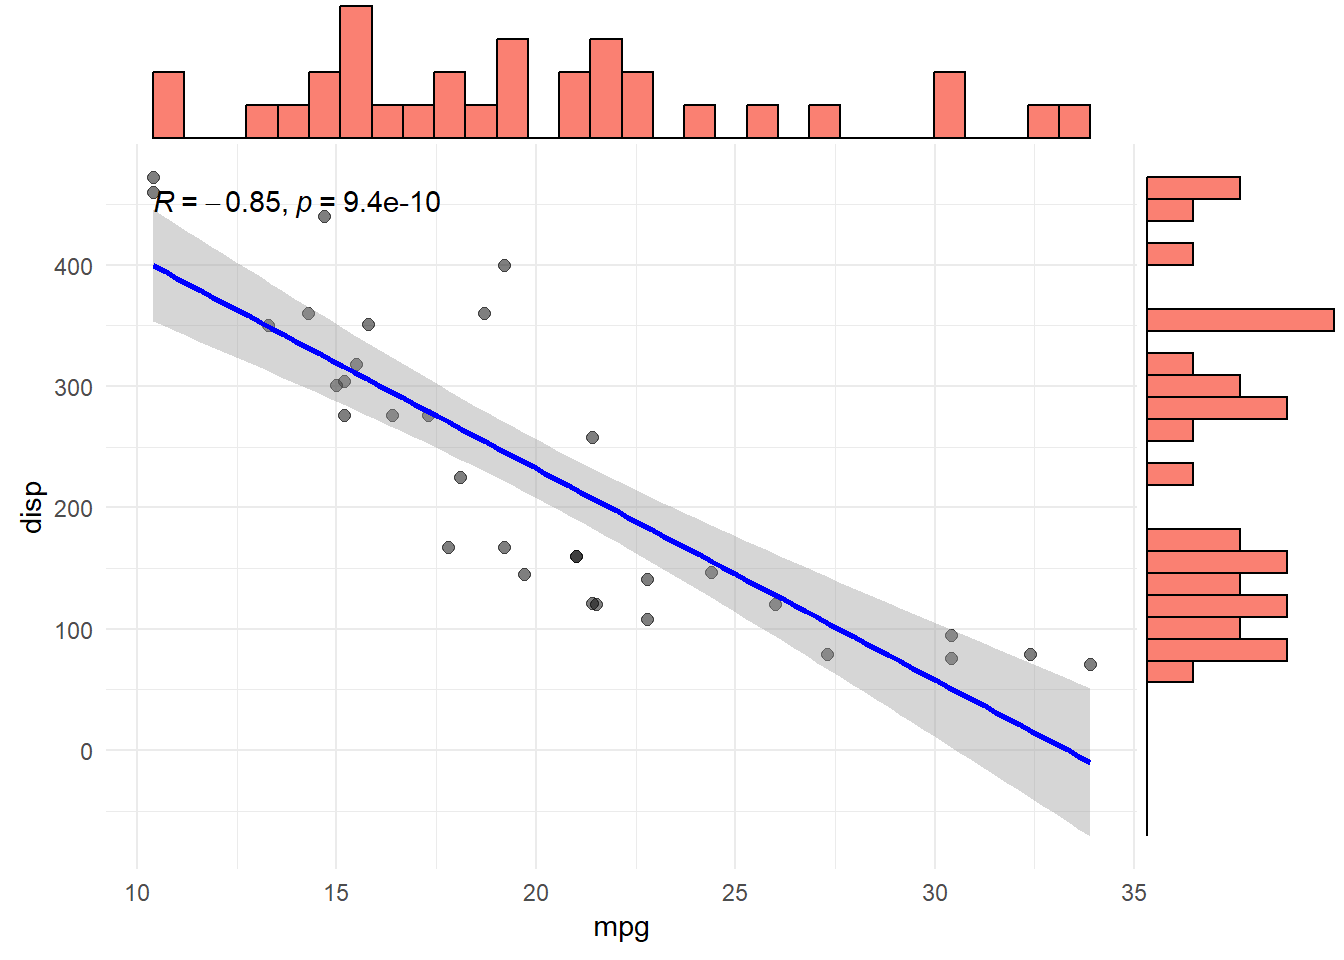
p <- ggplot(mtcars, aes(x = mpg, y = disp)) +
  geom_point(alpha = 0.5, size = 2) +
  geom_smooth(method = "lm", se = TRUE, color = "blue") +
  stat_cor(method = "pearson",  # 自动添加相关系数
           label.x.npc = "left",
           label.y.npc = "top") +
  theme_minimal()

# 添加边缘直方图
ggMarginal(p, type = "histogram", fill = "salmon", bins = 30)
`geom_smooth()` using formula = 'y ~ x'
`geom_smooth()` using formula = 'y ~ x'